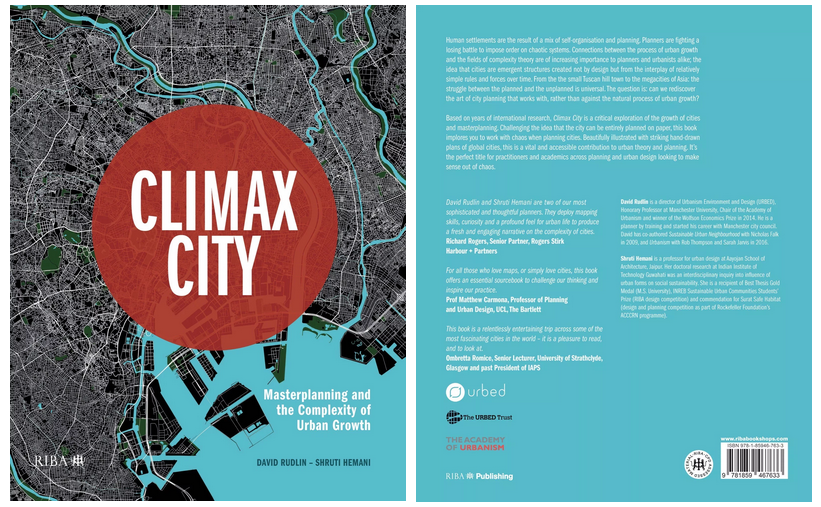
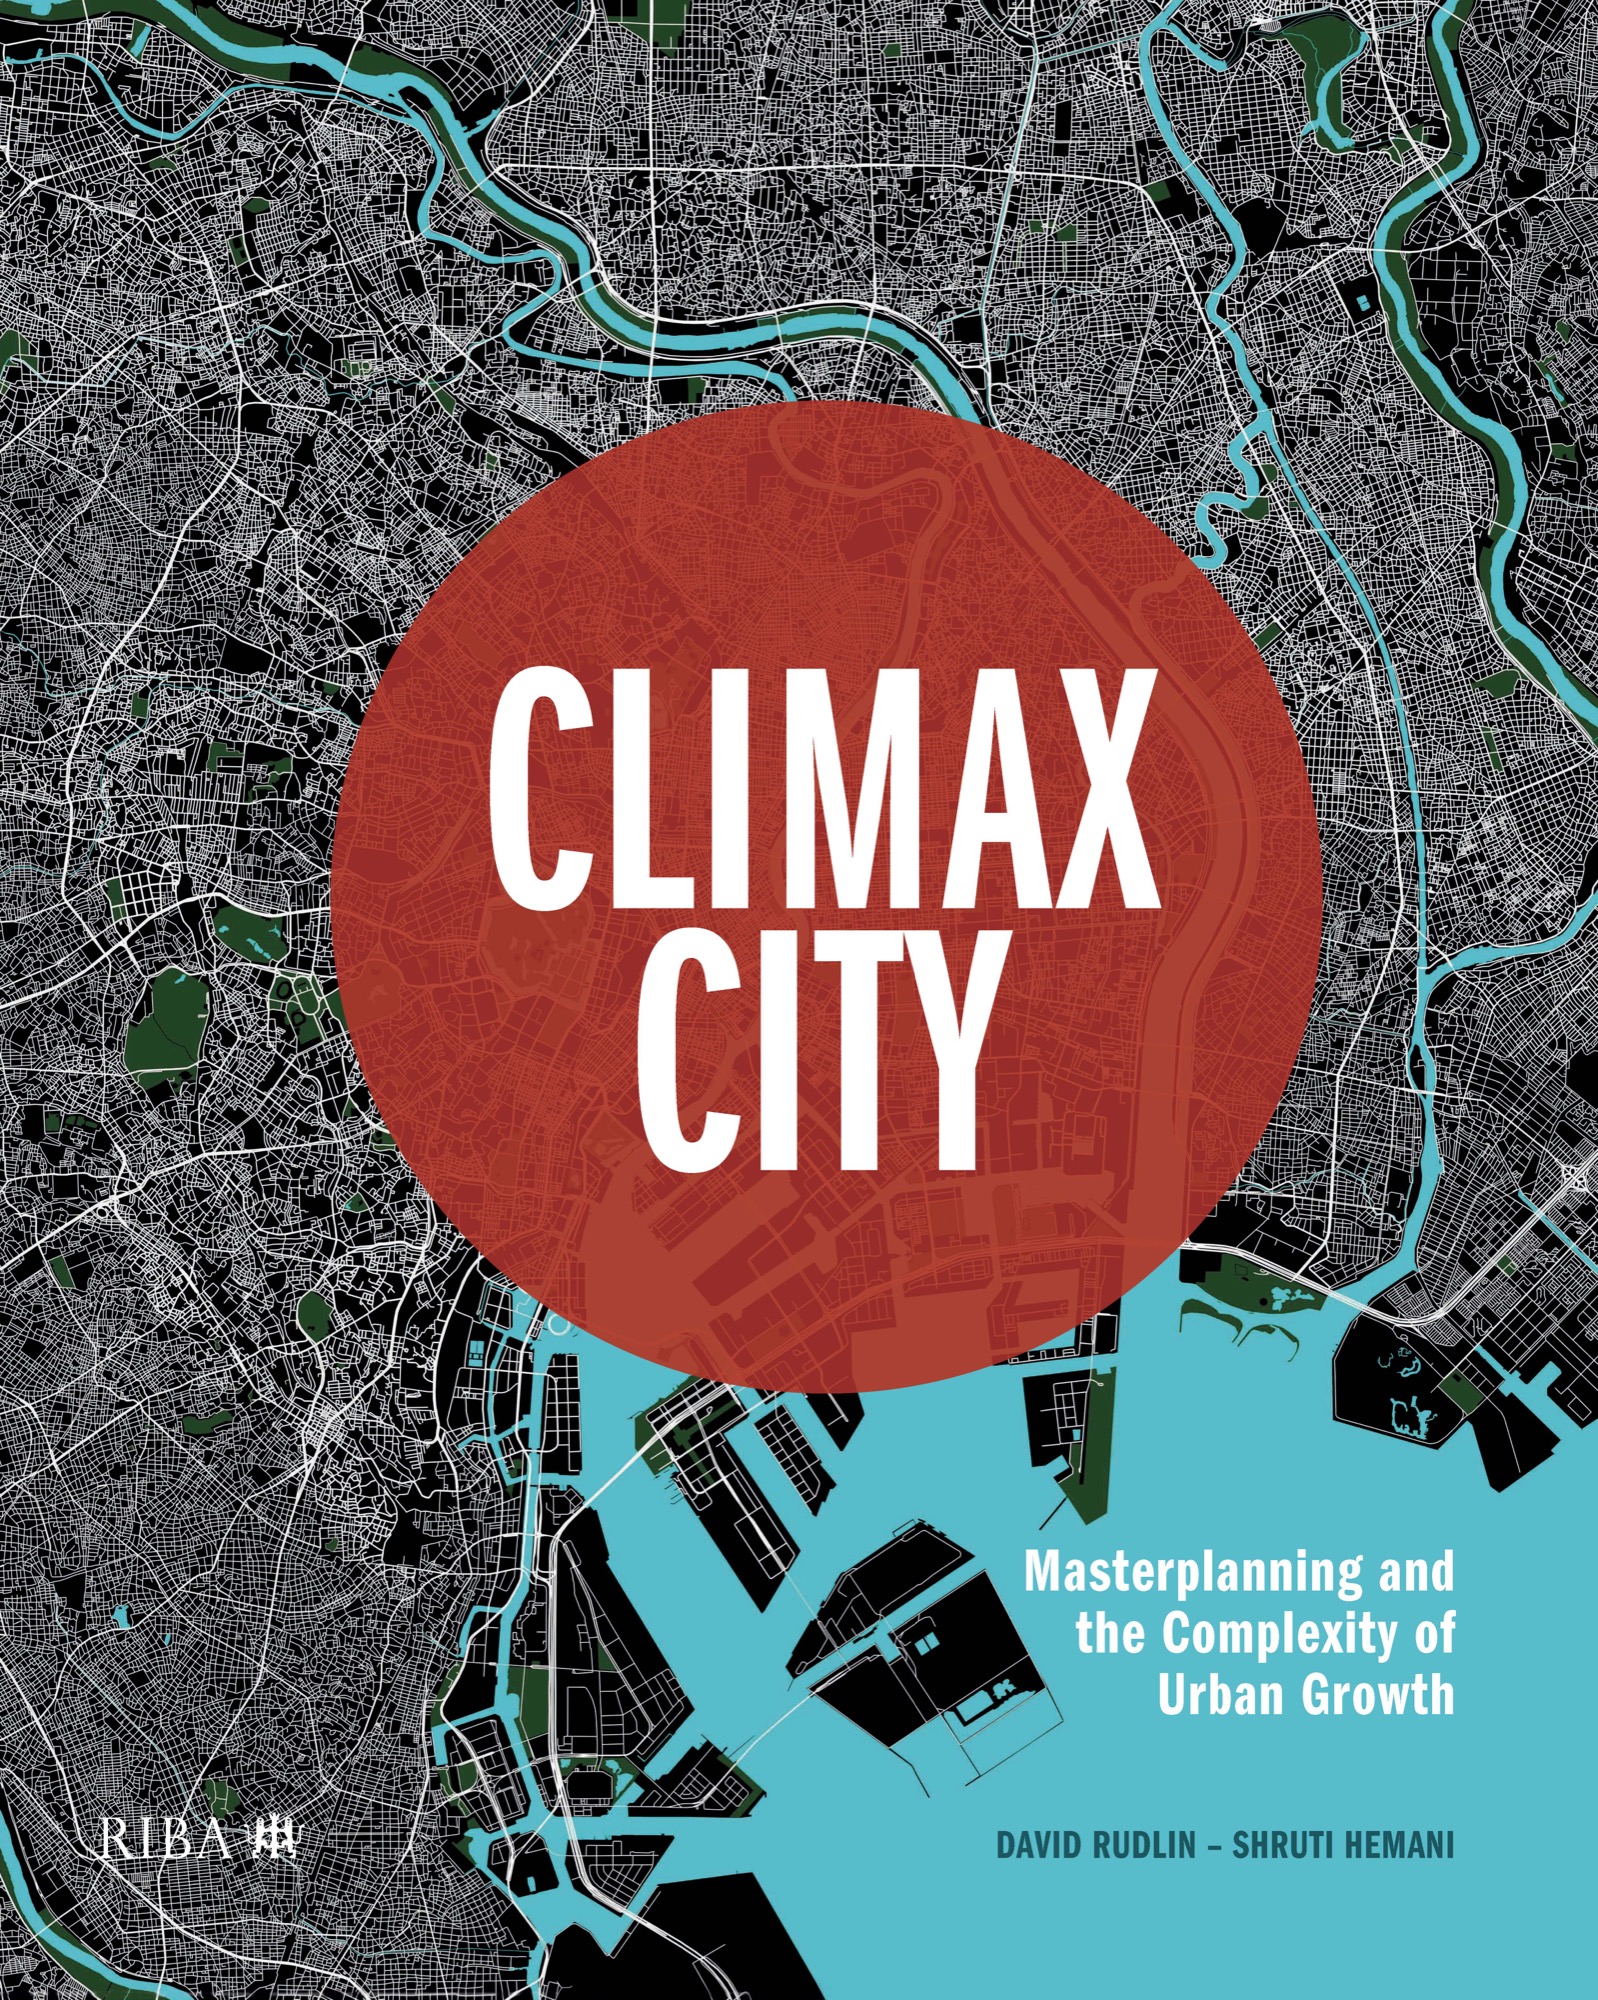
Book Title: Climax City, Masterplanning and the Complexity of Urban Growth
Authors: David Rudlin and Shruti Hemani
Publisher: RIBA Publishing
Book Size and Binding: 250 X 210 mm, Hard Cover, 320 Pages
Buy from:
Preface: / David Rudlin and Shruti Hemani
Obsessive Cartography
This book started life as a book of maps. Maps that have taken a lot of time to draw, huge amounts of time in fact. So much time that we have been branded by friends and family as obsessive. Before we start, let us offer a defence, or at least a plea in mitigation.
We were first introduced to the figure ground plan by the architect George Mills in Manchester. He drew, or got his office at MBLC Architects to draw, figure ground plans of cities. We still use the plans that they produced of Bordeaux, Dublin, Glasgow, London, New York, Palma and Turin, each like a fingerprint, encapsulating in a simple image the personality of the place. But the plans that George produced which really excited us were the historical sequences of Manchester. There was a famous set of Hulme, but the ones I remember best were a sequence for the Moston Valley in North Manchester. The first plan showed the straggling development of pre-industrial Manchester; the second the explosion of the Victorian city; the third the damage wrought by the council estates in the 1960s; the fourth the desolation of the area as it was then (and still is today); and the fifth the plan with MBLC’s masterplan inserted. It was an epic story of bounty and squalor, success and failure and, like all good stories, it had a happy ending – the good urban designer put right the wrongs that had been visited on the neighbourhood throughout its history (even if they were never entirely built). This was cartography as narrative on a grand scale, and it revealed things that none of us had really understood before.
The figure ground plan has since become a regular tool in our urban design work. By showing buildings in black and removing most other detail, they reveal the truth about a place. Like X-rays, they are calibrated to see through the tissue of detail on a map or aerial photo, revealing the underlying structure of an urban area. In doing so, the plans reveal the shattering and decay of many industrial towns and cities as well as the inner beauty and structure of ‘healthy’ urban places. You can look at the figure ground plan of a city and ‘read’ the place: you can generally tell where the centre is and trace the transept to its suburbs, you can follow the line of the most important commercial streets, identify which districts are thriving and which are declining. In the UK, you can even date, to within a few decades, and identify the tenure of most of the residential areas – the Victorian terraces, garden cities, the interwar suburbs, the 1950s walk-up, 1960s deck-access and 1970s Radburn estates, the 1980s Thatcherite suburbs, the 1990s docklands and the 2000s apartments. All leave their distinctive fingerprint on the plan. Figure ground plans also shine an unforgiving light on masterplanning work – draw your plan as a figure and ground and ask yourself, can you still see the structure and does it look coherent? Many plans use densely-rendered landscape and public realm to make a beautiful drawing, but strip away all of these graphics and the underlying plan fails the figure ground test.
In the early days, we used to draw figure ground plans by hand. This was a painstaking process but it gave the plans a satisfyingly crafted feel. Over the years, technology has made these plans much easier to produce – with digital map data it is now possible to isolate the building layer and use a global fill command to produce a figure ground plan in a matter of minutes. This is great for productivity but something is also lost. Drawing is an intensive way of looking, and all those hours spent producing figure ground plans by hand were not necessarily wasted. Just as with drawing from life, a hand-drawn plan forces you to look at every part of a place and, through your pen, to understand how it works.
The first really big plans that we drew were for an exhibition at the Centre for the Understanding of the Built Environment (CUBE) gallery in Manchester in 2002. I (DR) had been trying to persuade Graeme Russell, the gallery director at the time, to let me do an exhibition on urbanism. Graeme’s view was that urbanism wasn’t sufficiently visual to create a good exhibition. His policy was to run CUBE like an art gallery focusing on the built environment, so he wasn’t interested in worthy, wordy exhibitions.
Nevertheless, a gap appeared in Graeme’s programme and he asked us to do something for the small gallery alongside a much larger exhibition, judging that if our exhibition was a failure it would only be a small one. As soon as we started working on material we realised that Graeme was right. We had planned to use a sequence of figure ground plans of Manchester as part of a series of boards about urbanism. However, as we started drawing the plans, they took over. We soon decided to drop everything except the four plans showing Manchester at different stages of its development. The plans were united by a circle 1 mile (1.6 km) in radius and were from 1784, 1824, 1900 and 2000 (we have since updated the 2000 plan and added the 1981 plan, which was the city’s lowest point). We blew the plans up as big as the printers could manage and hung one on each wall of the white cube gallery. The result surpassed all of our expectations. From the centre of the room, they resembled abstract paintings. Yet, as you approached each panel, the structure of the city became clear, resolving with proximity into buildings and space. People at the exhibition would lose themselves in these plans, finding streets they knew then tracing paths through the abstract shapes, seeing the structure of the city as if for the first time, and understanding why certain places did and didn’t work.
The CUBE maps were hand-drawn; this was out of necessity because there are no digital historic maps and, in any case, we couldn’t afford to buy digital data for the area that we wanted to cover. Nonetheless, the maps wouldn’t have worked if they had been computer generated; there was something pleasingly crafted about them, and the sheer scale of the drawing conveyed something of the scale of the city. In reality, the scale of the drawing was a huge challenge – a 2-m2 drawing using a 0.5-mm Rotring pen. This was only possible with the press-ganged labour of family and friends who helped with the drawings, which in places are admirably loose in their execution. We finished the mammoth 1900 plan the night before the exhibition was to open and delivered the plans to the print bureau in the morning, arriving at the gallery a couple of hours before the opening to find Graeme wondering how he was going to explain the empty walls.
Those plans of Manchester were the first of the really large figure ground plans. In the years that followed, our office used the excuse of studies or tenders to do some more large-scale figure ground plans. We did plans of Brighton, Hull, Birmingham, Liverpool, Leeds and Telford using students as cheap labour where possible. All of these plans taught us new things about the places that we drew. Would you guess, for example, that the most fractured city of this sequence was not Hull or Liverpool but Leeds (the reason is that the fracturing is as much the result of highway engineering and bad planning as decline). In many ways, the most extraordinary plan is Telford, which is of course a new town. The Telford plan shows more eloquently than any words ever could the folly of post-war planning. It is low density, lacking in structure and impossible to read. Anyone not knowing the town could never tell from the plan where the centre was located. However, what is truly extraordinary is the thin thread of urban form that runs across the plan about two-thirds up the drawing. This, amazingly, is Watling Street, the Roman Road from London to Chester, which has somehow survived the New Town planners.
A few years later, I (DR) broke my ankle and found myself holed up at home with time on my hands. The year previously we had been in Barcelona and I started to wonder whether we could use the maps to compare it with Manchester. Barcelona has an important place in the history of Manchester’s renaissance as a role model to Manchester’s leaders when they were bidding to host the Olympics. In many respects, it was the realisation that Manchester couldn’t hold a candle to Barcelona that spurred the council in Manchester to take action. The first plan I did of Barcelona was not a figure ground plan but a plan that looked at the street grid of the city, which is its defining feature. I wanted a plan that captured the scale and structure of the place, so I widened the drawing to cover a 10-km radius circle and called the drawing a trellis plan. The name comes from the phrase coined in our first book, Building the 21st Century Home, which described a masterplan as ‘a trellis on which the vine of the city can grow’. The Barcelona trellis plan took weeks to finish. Then I started work on a similar plan of Manchester, rendered with white roads on a black background. If the figure ground plan was an X-ray, the trellis plan was more like a CAT scan, recalibrating the image to bring into focus the circulatory system of the city, its arteries, veins and capillary blood vessels. Also, because of the wider area covered, the trellis plan gave a sense of the scale and sprawl of the place. The 3.8 million people of Barcelona fit comfortably within the 10-km circle, despite the fact that a third of it is the Mediterranean. The 2.8 million people of Greater Manchester, by contrast, sprawl off the edges of the plan in all directions. Not only that, but the network of streets in Barcelona looks somehow healthy, while Manchester’s looks diseased and wasted. The plans again told us something that we didn’t know and explained it in a very powerful way through two simple images.
This was the point at which the obsession took hold and spread to Shruti. We started asking how New York would compare to Paris, Istanbul to Shruti’s home town at the time of Ahmedabad, Tokyo to Brasilia. This is something that had been very difficult to do until the advent of online mapping and, of course, Google Earth. These tools have allowed us to assemble baseline plans for all of these places, and more, at the same scale as the basis for the mapping which is still done by hand – albeit now with a tablet onto a computer rather than with a pen. This process of seeing and exploring started to raise further questions. Unlike Barcelona, many of the cities disappear off the edge of the 10-km plan, prompting us to ask how far they spread. We therefore created a 50-km context plan to show the extent of the settlement (although Los Angeles spreads beyond even this). At the more detailed scale, the figure ground plans raised questions about the anatomy of neighbourhoods and urban blocks. We thus started looking at ‘public realm’ plans and even at detailed ‘tissue’ plans. This gave us five layers, each five times larger than the preceding plans: tissue plans at 80 m, public realm plans at 400 m, figure ground plans at 2 km, trellis plans at 10 km and context plans at 50 km.
These five levels, multiplied by the list of 35 world cities that we initially drew up, create more work than the two of us can do in a lifetime, so expect to find only a small proportion of them in this book. This book is not so much about the maps, but about what we have learned by drawing them. Through our pens, we have understood these cities in new and unexpected (to us at least) ways. What really interested us was the constant interplay in the maps between the planned and the unplanned, the way in which you come across fragments of plan that have been eroded or undermined by the organic growth of the city. This is the main topic of this book: the interrelation of planning and ‘natural urban growth’ and the places that emerge.
We plead, therefore, for understanding, if not absolution, and hope that something of our obsession comes through the pages of this book.
Some inner pages of the book
About RIBA Publishing
RIBA Publishing is one of the leading providers of high-quality information for architects and other built environment professionals. With over 35 years’ experience, they publish authoritative and practical information for the market, from good practice, legal and management guides to technical design guides, and anything in between.
Authors:
David Rudlin
David Rudlin is a planner and currently director of URBED, Chair of the Academy of Urbanism and Honorary Professor at Manchester University. In 2014 he was the winner of the Wolfson Economics Prize. He is also a practitioners who in the early part of his career worked on the redevelopment of the Hulme neighbourhood in Manchester. He has worked at URBED for nearly thirty years and been responsible for many high profile masterplans and research .
Shruti Hemani
Shruti Hemani is an architect and urban designer. Her work focuses on design and research in the area of sustainable cities and social sustainability. Shruti worked at URBED before pursuing her doctoral research at Indian Institute of Technology Guwahati which was an interdisciplinary inquiry into influence of urban forms on social sustainability. Shruti is currently a professor based in Jaipur.

