The annual national ranking for Architecture and Planning Institutions, announced in August, brought no major surprises. Barring minor shuffles within them, the top ten-ranked institutions have remained stable. The only significant change is that Visvesvaraya National Institute of Technology (VNIT), Nagpur, previously ranked 12, has now secured the 10th position. Aligarh Muslim University, 9th in 2023, has moved to 14th in 2024. The dominance of IITs, NITs, and government institutes in the top rankings continues. CEPT University, a private institution ranked sixth, is the only exception (a disclosure is warranted here: the authors are employed at CEPT University).
What parameters significantly influence the ranking? Is it necessary to allocate more resources to improve ranking? Can an institution focusing on training professionals without extensive research work still make it to the list? Do faculty profiles play a crucial role? Questions abound.
We address some of these intriguing questions by unpacking the ranking data of the top ten institutions. We have considered only 2024 data for this purpose, as some parameters were changed and new ones added in 2024, making comparisons with previous years’ data sets difficult. Across categories, these changes have impacted the data collection method and analysis. For instance, self-citations for research and professional practices have been removed. New parameters on sustainability, courses on the Indian Knowledge System, and teaching in multiple Indian regional languages were introduced. If the ranking method remains unchanged in the coming years, we can revisit this exercise after a few years for a more robust analysis.
Context
National Institution rankings have been gaining significant traction since its launch in 2016. These rankings are eagerly awaited, and institutions showcase them as a major accomplishment. State governments and funding agencies are increasingly placing importance on these rankings, and students and parents are closely following them. What started as a modest attempt, limited to only universities and three disciplines—engineering, management, and pharmacy—has now expanded to include eight categories of institutions and eight subject domains. The number of applicants has also significantly increased, from 3,565 in 2016 to 10,845 in 2024.
The architecture domain was included in the ranking in 2018, and planning was combined with it in 2023. This year (2024), about 115 institutions participated in this domain: 44 from the south, 40 from the west, 23 from the north, and eight from the east. This distribution broadly reflects the geographical distribution of the institutions. Though 115 institutions participated, only the first 40 ranks were published.
Parameters
The National Institute Ranking Framework (NIRF) handbook explains the parameters and methods used for ranking. It also publishes the scores of all the ranked institutes, which helps understand the process and track changes. In 2024, architecture and planning institutes were ranked using 15 parameters spread over five categories. The table below (Table 1) shows the parameters, their scores, and their weightage.
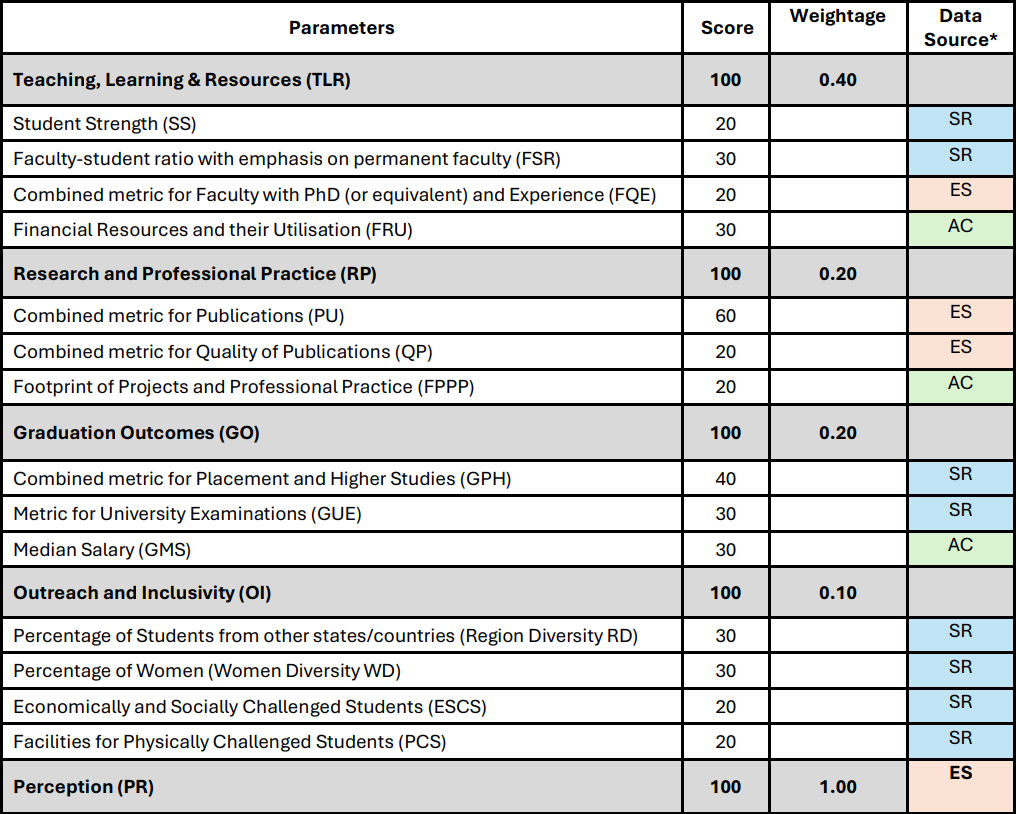
Data sources: SR—Self Reported by the institutions and accessed by authors from the NIRF Website; ES—External Sources as mentioned by NIRF, detailed data not available; AC—Authors’ Calculations, based on the data provided on the NIRF website.
The Teaching Learning and Resource (TLR) category, combining student strength, faculty-student ratio, faculty profile, and resource utilisations, has the maximum weightage; others have lesser weightage (Table 1). The institution self-reports most of the information. A few, such as the publications list and citation index, are derived from sources such as Scopus and the Web of Science. Patent data are obtained from Derwent Innovation.
Top Ten Ranks in 2024
Based on the weighted scores of 15 parameters, the top ten ranks are as follows:

Source: NIRF

Source: NIRF
Patterns
The scores reveal three divisions: the first three institutions, Indian Institute of Technology – Roorkee (IIT-R), Indian Institute of Technology – Kharagpur (IIT-K), and National Institute of Technology – Calicut (NIT-C), with about 80 marks and above, differ distinctly from the rest. The fourth and fifth ranks fall behind with ten marks and more, but they are separated by less than one mark between them. The subsequent four ranks, starting with the sixth, are separated by a minimum of one mark and a maximum of four marks.
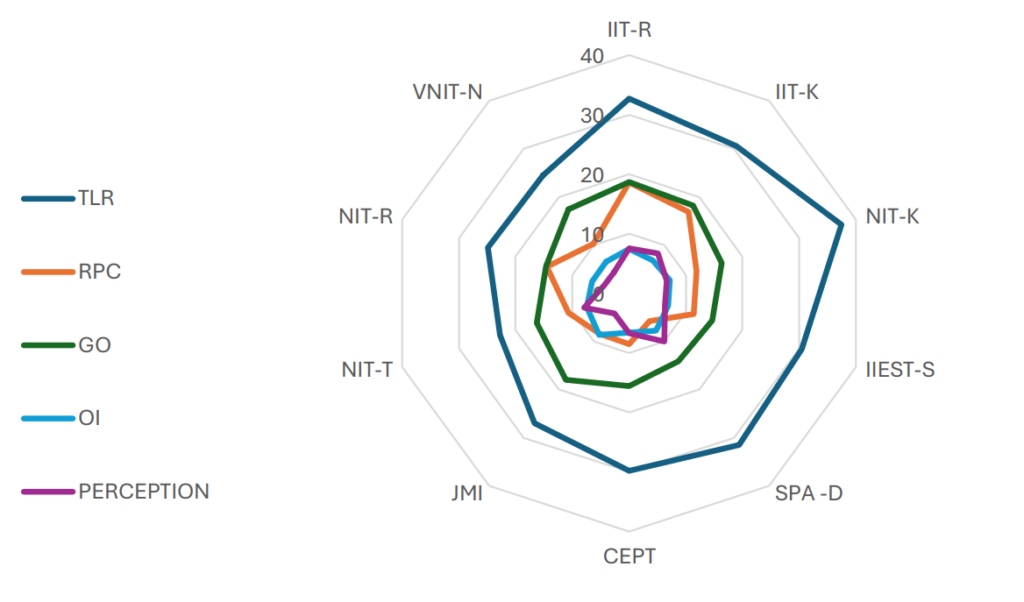
What caused these three divisions? It isn’t easy to pinpoint the swings and reasons if we only look at the clustered parameter level (five categories). For instance, in the Graduation Outcomes (GO) cluster, which includes pass percentage, higher studies, placement, and average salary, Jamia Mallia Islamia (JMI), ranked seventh, did better than NIT-C, ranked third. In the Outreach and Inclusivity (OI) category, which includes parameters such as gender balance, regional diversity in intake, support for economically weaker sections and facilities for physically challenged students, NIT-Trichy and JMI have done better than the first and second ranks. The spider diagram (Figure 1) illustrates this mixed performance.
Source: NIRF
Detailed Analysis
One can extract valuable insights by looking closely at the 15 parameters, their detailed scores, and the calculation methods. Calculations of a few parameters are unclear in their current form, making it difficult to explain their role fully. More of it later. We first look at what is evident (see Annexure 1—at the end of the article—for raw scores for each of the 15 parameters).
Source: Authors’ calculations based on data retrieved from NIRF
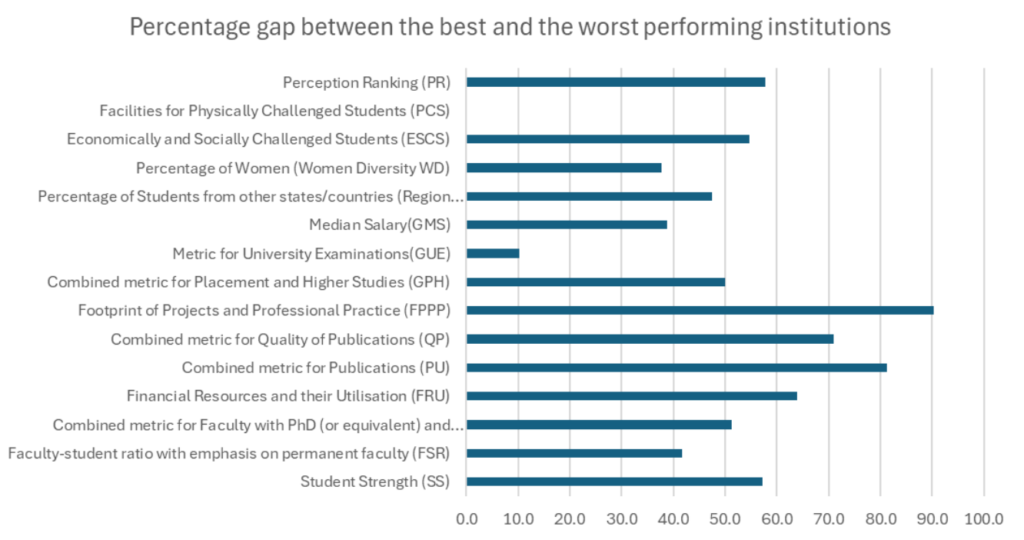
The percentage difference in scores between the highest and least-performing institutions is one quick way to understand the difference (Figure 2). Further differences emerge when we combine this with detailed scores of parameters. For instance, all institutions have done well with facilities for physically challenging students (PCS), with minimal percentage differences. On the other hand, important variations in parameters such as footprints of projects and professional practice (FPPP) and combined metrics for quality of publications (QP) emerge as the major differentiating factors. The following sections look at scores in detail to flesh out the differentiators further.
Everyone has got this right.
All the top ten institutions have done well in terms of student-faculty ratio (Table 4). Institutions with a 1:15 faculty-to-student ratio get full marks. For this purpose, full-time faculty with three years of experience and those appointed on an ad-hoc basis who have taught for two consecutive semesters have been considered. The regulatory and accreditation mechanisms that insist on minimum faculty strength have helped most institutions achieve this. The only exception in this has been NIT-T, which has scored less than 60% of the marks. IIT-K has the lowest faculty-to-student ratio, but its score is above 60%, possibly due to a larger postgraduate program intake (104 approved intake in the postgraduate program) compared to NIT-T (50 approved intake in the postgraduate program).

Source: Self-reported by the institutions
Similarly, most of them have done well in terms of university exam metrics (Table 5). This is calculated based on the percentage of students passing the university exams within the stipulated time of the program. The same is true for the percentage of women students in the institutions and the campus facilities for people with disabilities. This is also evident in the comparison between the best and least performed among the top ten institutions (Figure 2).

Source: Self-reported by the institutions
None have got this right.
None of the top ten institutions has done well in the category of socially challenged students, which is the percentage of undergraduate students who are provided full tuition fee reimbursement by the institution. VNIT Nagpur ranked ten scored zero; the first-ranked IIT-R scored about 25 %, and the second-ranked IIT-K scored about 19 %. JMI has scored a maximum of about 55 %.
Differentiators
A few of the 15 parameters, such as the median salary, percentage placements of students selected for higher studies, and combined metrics for publication, seem to have a clear impact.
The median salary of graduates (Table 6) in the undergraduate and postgraduate programs in the previous three years has a direct bearing. Median salary figures (in Rs. Lakh) in Table 6 are averages of median salaries received by U.G. and P.G. students over the last three years, as reported by the institutions. IIT-K, which has a median salary of Rs. 9.2 lakhs, scored 100 % marks, followed by IIT-R, with a median annual salary of Rs. 8.6 lakhs and about 90 % marks. The lowest is IIEST-Shibpur, with a median annual salary of Rs. 4.8 lakhs, scoring 61%.

Source: Authors’ calculations based on data provided by the Institutions, accessed from the NIRF website
The average percentage of placements in undergraduate and postgraduate programs and the percentage of students selected for higher studies seem to influence the final ranks, as variation in scores on this parameter is significant. It appears that the scoring function provides equal weightage to both the outcomes, placements, and higher studies (Table 7). A comparison between scores of CEPT and IIT-R is a case in point. Despite reporting higher placement percentages, CEPT’s score (27.61) on the combined metric is lower than IIT-R’s (36.21). However, a higher percentage of IIT-R students are selected for higher studies than CEPT, which seems to have influenced the score.

Source: Authors’ calculations based on data provided by the Institutions, accessed from the NIRF website
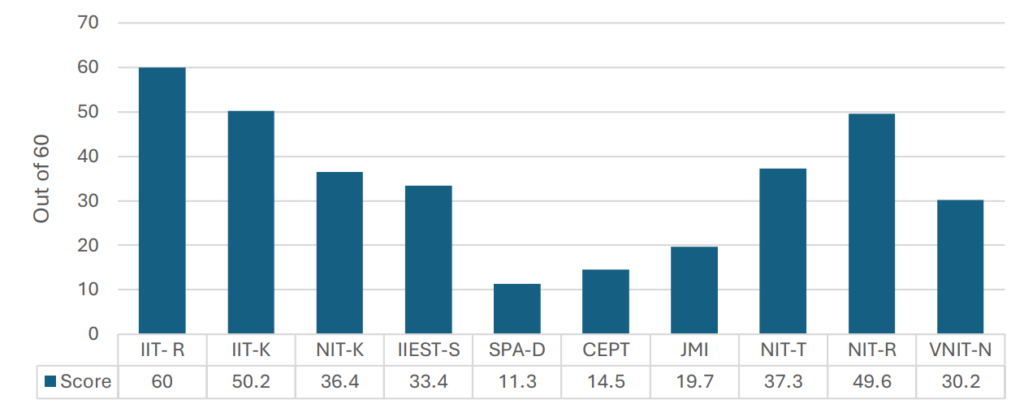
The second strong differentiator is the combined metrics for publications (Figure 3). This parameter is about the number of publications divided by the nominal faculty members in each institution. IIT-R scored 100 %, followed by IIT-K, which scored about 85%. The remaining Institutions drop substantially, and the lowest among the top ten is less than 20%.
Source: External source, taken from NIRF Report
Inadequate information
Information on three critical parameters is incomplete, making it difficult to conclude their potential impact.
First is the Financial Resources and their Utilisation (Table 8). This has two components. One is the Average Annual Capital Expenditure (excluding expenditure on land and buildings) per student for the previous three years in the architecture discipline only. Second is the `Average Annual Operational (or recurring) Expenditure per student for the previous three years for the architecture discipline only (excluding maintenance of hostels and allied services).’ The figures are given in Table 8 are averages of the expenditure numbers reported by the institutions. The total number of students enrolled in undergraduate programs is used to calculate the average expenditure per student. Operational expenditures appear to have a higher weight than capital expenditures.
The Handbook on Methodology for Ranking of Academic Institutions by NIRF considers only expenses for the architecture discipline. There is no clear explanation that the operational and capital expenditures reported by the institutions are only related to architecture. Similarly, while the enrolment figures reported for undergraduate students seem specific to the architecture discipline, postgraduate figures in some institutions seem to have combined planning students. Hence, it is difficult to analyse this parameter in greater detail. However, for this exercise, we assumed the expenses were related to architecture and divided them by undergraduate student numbers alone. Hence, the below figures have to be viewed only as a demonstration of the possibility.
The top-ranking institutes, such as IIT-R (Rs. 7.4 lakhs), IIT-K (Rs. 12.09 lakhs), and NIT-C (Rs. 10 lakhs), have higher per-student operational utilisations compared with SPA-D (Rs. 6.58 lakhs) and CEPT (Rs. 5.73 lakhs). While the amount spent by the top three institutes, in absolute figures, is low, the higher enrolment in SPA-D and CEPT seems to have brought the per-student figure lower. The average utilisation of operating expenditure for IIT-R is Rs. 12 crore, IIT-K is Rs. 24 crore, and NIT-C is Rs. 28 crore. In contrast, SPA-D and CEPT have an average utilisation of operating expenditure numbers of Rs. 55 crore and Rs. 33 crore, respectively.

Source: Authors’ calculations based on data provided by the Institutions, accessed from the NIRF website
The second parameter is the footprint of consultancy projects (Table 9). This parameter has two components: the average annual research amount received per faculty member over three years and the average annual consultancy amount received per faculty member in the previous three years. The numbers in Table 9 are averages of funding figures for research and consultancy, respectively, over the last three years, divided by the number of full-time faculty members, as reported by the institutions. The first two ranked institutions scored about 80 % and 90 %, respectively (Table 9). SPA-D, which is ranked fifth, has scored 60%. The remaining institutions have not even met the 50 %. NIT-T, ranked 8th, has scored only 10%. However, the story is a bit complicated when we look at the absolute amounts each institution has received for consultancy projects. The numbers are not commensurate with the ranking.
It does not add up even if we go by the NIRF criteria of the average funding per person and not the total amount. For instance, CEPT’s average funding per faculty is about Rs. 36.6 lakhs, SPA Delhi’s is about Rs. 22.6 lakhs, and IIEST-S has about Rs 7.47 lakhs. But their scores seem inversely proportional. CEPT scored 6.88, while SPA-D scored 12.46, and IIEST-S scored 7.34. Similarly, the difference between IIT-R and IIT-K is not directly relatable.
The methodology for rankings document 2024 for Architecture and Planning Institutions, mentions that it imposes a function on the average funding to arrive at the score. It is not a direct conversion. What this function is and how it is computed are not clear.

Source: Authors’ calculations based on data provided by the Institutions, accessed from the NIRF website
The third parameter is peer perception (Figure 4), measured by surveying employers, professionals, and academics to ascertain their preferences for graduates from different institutions. However, details on the number of samples, the number and distribution of resource persons, and a summary of responses are not provided, making it difficult to analyse and identify the possibilities for course correction. Where one or two points alter institution ranks, even small improvements can make a big change. For instance, the difference between CEPT, ranked sixth, and SPA-D ranked fifth, is 1.8 marks. CEPT perception score is 6.7 out of 10, while SPA-D has scored ten on ten. Similarly, the difference between JMI, ranked seventh, and CEPT, ranked sixth, is only about 1.1. JMI perception score is 4.2, and the CEPT score is 6.7. An incremental increase in JMI’s score would have changed its ranks.
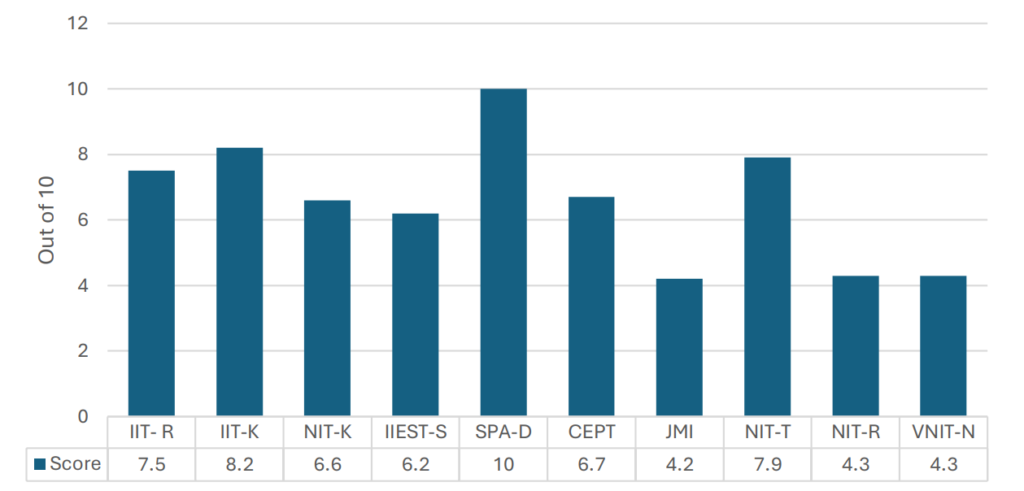
Source: External source, taken from NIRF Report
Takeaways
Four key takeaways emerge. First, the clear recipe for achieving higher NIRF rankings lies in increasing the number of UG and PG programs, maintaining a 1:15 faculty-student ratio, achieving a balance between experienced and young faculty, maintaining regional and gender diversity and ensuring inclusive practices.
Additionally, hiring faculty with significant research potential and providing them with enough funding support and consulting exposure will help. Institutions have to focus on operational expenditure for existing activities while trying to build new facilities.
Second, aspiring institutions must go beyond the minimum education standards recommended by professional regulatory frameworks. For instance, the Council of Architecture does not insist on a PhD as a prerequisite for recruitment, while NIRF favours faculty with a PhD. Given that small percentage points determine rank positions, institutions that seek to improve would, as they go forward, have to recruit more PhD holders. This will also have a bearing on research projects and paper publications, which, yet again, significantly impact ranking.
Strengthening the PhD programs will be helpful, as it will create a pool of research-oriented faculty members to deepen research in the discipline and support other institutes.
A related point is that NIRF emphasises that senior, middle, and junior faculty members should be distributed equally. It prescribes a ratio of 1:1:1. Meanwhile, regulatory norms prefer the faculty ratio in the order of 1:2:6, with more junior faculty and relatively lesser senior faculty. The implication is that private institutions desirous of scoring points in this parameter must go beyond the norms, which will impact the cost of education.
The third aspect is the orientation of institutions. Many architecture and planning institutions focus only on teaching and professional training and perform poorly in publications. This is evident in the reported data. About 1,373 engineering institutions have published 2,64,458 publications. In comparison, 108 architecture and planning institutions have published only 46 papers. Of the 108 institutes, 90 of them have zero publications (p. 13). When read along with the individual institution publication data (Figure 3), it is clear that IITs and NIITs are better orientated towards and focused on this feature.
If institutions are keen to improve their ranking, attention to research and publication is imperative.
In this context, NIRF must consider that some professional institutions focus on applied research and prepare manuals that directly support practice. Although such publications are as critical as other academic research publications, they do not figure in the ranking assessment. This can be considered in future editions.
Most architecture and planning institutions are private, and their revenue models are perilously tied to fees. Ranking for them remains aspirational as they require more resources. Unless they scale up in terms of enrolment by starting multiple programmes, investing in research, running PhD programmes, supporting faculty and having a robust consultancy structure, they cannot desire to make it to higher ranks. Large private institutions with good financial outlays could plan and commit to making it to the rank list.
Other smaller teaching institutions known for quality education and training would stay out either by choice or otherwise. They, too, need to be acknowledged and appreciated through some means.
The fourth takeaway is that while institutions can identify and work on parameters directly related to their performances, a few mostly depend on potential employers and market forces. Publication, research and consultancy projects, outreach, and inclusivity are directly and undilutedly connected to institutions’ efforts. In contrast, demand and supply and employers’ willingness to pay determine graduates’ salaries. However, institutions’ training determines students’ performance in the field, affecting recruitment. Similarly, peer perception is key in ranking and determines how the alumni, market, and other organisations perceive the institution. Institutions may not have control over this, but continuous quality improvement, staying updated, developing the organisation, and having better outreach may help.
The NIRF effort and the published data are helpful. The metrics give the institutions a framework to self-evaluate and plan their direction. It also gives students and parents indicators of institutional performance.
As we proceed, more information can make the analysis robust and help draw more useful conclusions. By publishing information on functional conversions and complete data sets, institutions will be able to find associations or correlations between efforts and outcomes. This, in turn, will translate into clear guiding principles for improving performance.
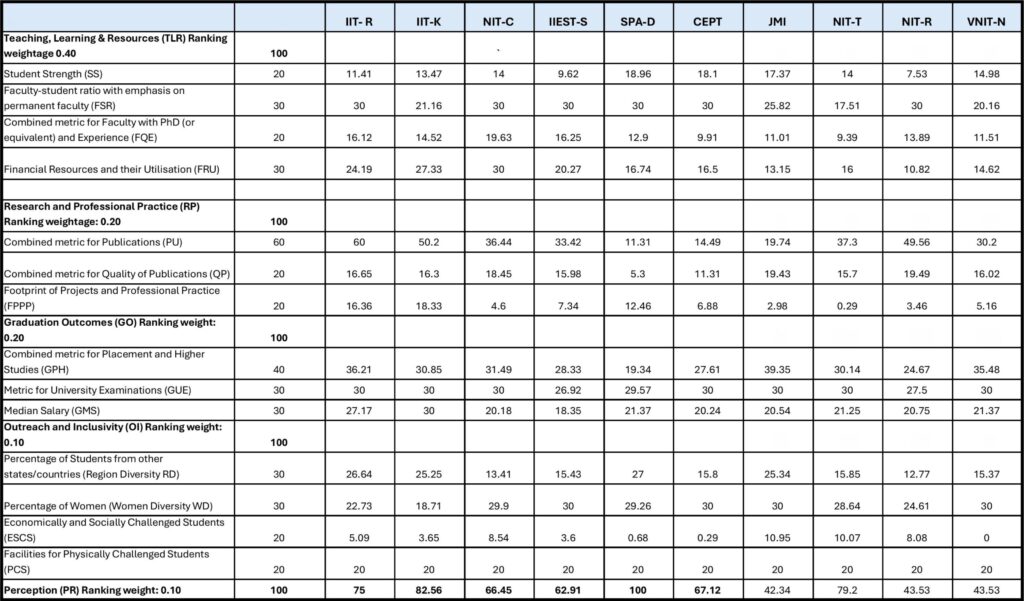
Source: NIRF


